| |
May 21, 2009
Our First Sale
Today. Sheryl,
Dan and I got together to review our May Challenge list and other stocks
on our watch lists. Our biggest concern was Tower Group. A
recent merger announcement wasn't well received and downgrades have been
coming. We cut our losses at $23.81, realizing that little losses
turn into bigger losses if our expectations are not met. Interesting
to note, we can see immediately where we made our mistake.
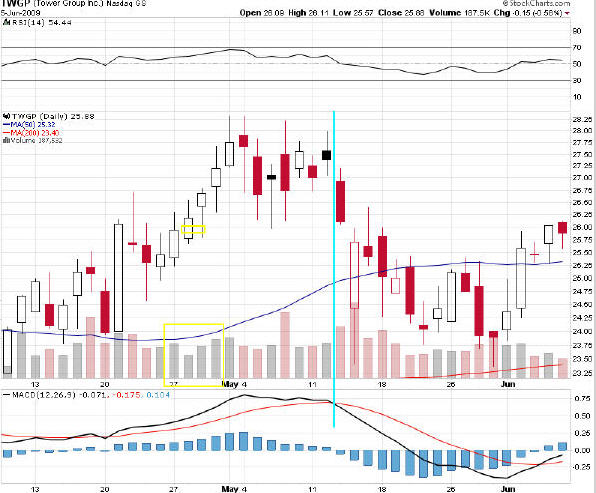
Here is the 60
day chart. The small yellow square is where we purchased. It
was within our range and moving up. But look at the volume below in
the big yellow box. It was a "false" signal to buy since low volume
meant there was no support. Now note the Aqua colored vertical line.
That is when the MACD at the bottom crossed under the trigger, giving us
an opportunity to correct our mistake before we lost any money.
Unfortunately, as long term investors, we were not comfortable putting a
stop under the price. so we rode it down to $23.81 before we could admit
we were wrong.
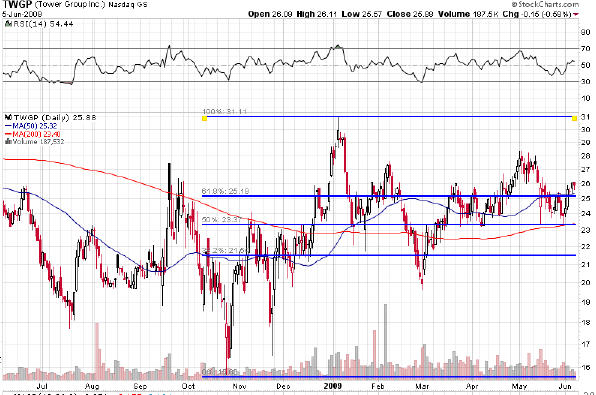
Now look at
the annual chart with Fibonacci lines drawn. That blue horizontal
line, 2nd from the bottom, shows a fairly clear support line around
the $23 price point. And a trader friend told me it's no coincidence
that it's in line with the (red) 200 dMA. This is where we should have
purchased in the first place. OK, live and learn! The rest of our
meeting details are provided by Sheryl.
Lynn
More on Tower Group:
I fully
support our decision to sell Tower Insurance Group. There have been more
analyst downgrades than upgrades in the past month. Investors have been
selling the stock in recent days and we are not sure where the stock will
find its support level. We have chosen to sell our position in Tower
Group, thereby, cutting our loss at 8% below our buy price.
Tower Group has entered the market for excess and surplus lines of
insurance through two acquisitions [Castle Point and Hermitage Insurance
Group], which closed on February 5, 2009. Excess and surplus lines are
non-standardized accounts that are underwritten based on individual risk
characteristics. It is unclear whether Tower Group will be as successful
in underwriting non-standard risks or whether margins will deteriorate
from a more hazardous mix of business.
Tower Group is not a typical growth stock; Tower Group operates in a
cyclical market where operating results aren't highly predictive. The
company is not currently repurchasing its shares as it is not trading at
particularly attractive levels. See the latest earnings transcript for
commentary from management.
Adding to ESI:
ITT
Educational Services had an extremely favorable earnings release. Several
analysts have raised their guidance in response to robust operating
results. Operating margins improved to 34.8% from 29.3% in the first
quarter due to sharply lower advertising expenses. Particularly
impressive, new enrollments rose 37% year over year and total enrollment
advanced 16%. The company added 88 program offerings in the first quarter
ended March 31, 2009 and is on track to add 250 program offerings in 2009.
ITT opened a new college in Concord, California and is on track to open 6
to 8 new colleges in 2009. We elected to add to our position in ITT on
market weakness at $99, which is within our target range.
Shall we buy Brazil?
The Brazilian
market has shown strong resilience in recent weeks. Brazil is rich in
materials, energy, and financial stocks. Banco Itau, Petrobras, and
Companhia Vale have been solid performers since the beginning of the year.
It may be prudent to enter the market by buying a basket of stocks rather
than try to pick the outperformer in the group. Stephen Leeb, editor of
The Complete Investor Newsletter has been recommending
Brazilian stocks for several months. Dan suggested we track the
performance of iShares MSCI Brazil Fund EWZ.
Sheryl
Second Purchase
May 11, 2009
Today, ESI
was moving up quickly in on a down market day. Originally, we wanted
to buy at $105 or less. We should have put in a limit order at $95
because it made it as low as $90 on this date. We took a small,
initial stake at $98.98, still well below the price we felt was fair.
Lynn
First Purchase
April 28, 2009
It was Dan and
I who met up again to review stocks and crunch numbers, while Sheryl sat
in a blind in northern Minnesota taking pictures of migrating prairie
chickens. (She lives such an interesting life! <G>) We spent the entire
meeting reviewing our February, March and April picks in all the tools -
Toolkit 6, Manifest Investing, PortfolioGrader Pro, Value Line, and
finally on the price charts on StockCharts.
The stocks we
want to own the most are either priced too high for our comfort level, or
their technical indicators are turning negative. Since we made
certain that ALL stocks are excellent on a quality basis, we were more
concerned with finding the picks with the most promising technical
indicators. There were two - Tower Group (TWGP) and Gilead Sciences
(GILD). Lynn
|
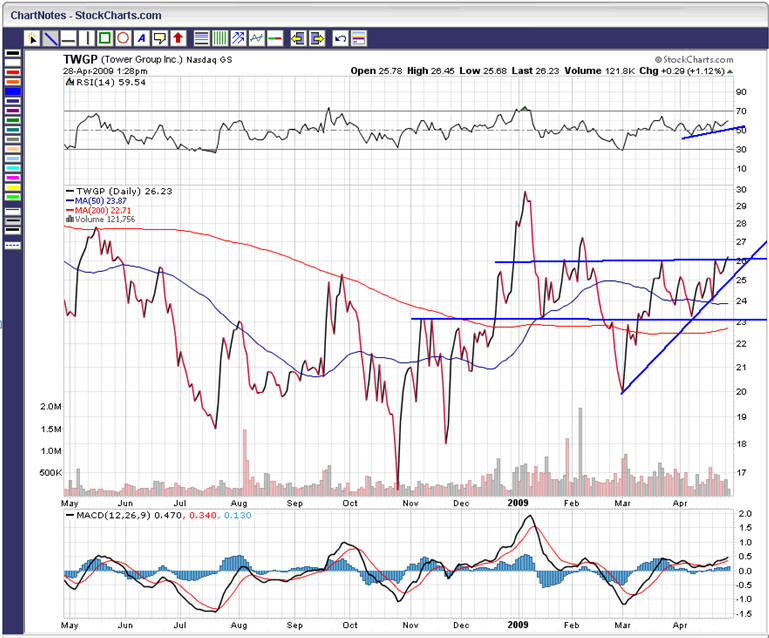
Tower's
stock price has been in a channel since around the first of March. We
could see a clear resistance line at $26. Today the stock
just broke through that line. The support trend has been moving
up, sporting higher lows. With the MACD in positive territory
and the RSI line trending up, we felt the stock was do for a breakout.
So we bought it.
The
current price is $26.41
The range for the day was $25.78 - $26.49
We put in a limit order for $26.13
Navellier just upgraded the stock to a strong buy
Yahoo
has a 1-yr price target of $30.60. If we can purchase it at $26.13 and
make it to the Yahoo target price, we would have a simple return of
18%. That's also the highest point on the chart for this stock.
Which means, we will probably put a stop underneath it, just in case
it decides to retreat with our profits.
We also
looked at the forward EPS estimates on Yahoo, and entered them on our
Stock Study form. The trajectory trend for 5 years would give us
a compounded return of approximately 21%. That would be nice! <G>
Lynn |
 |
|
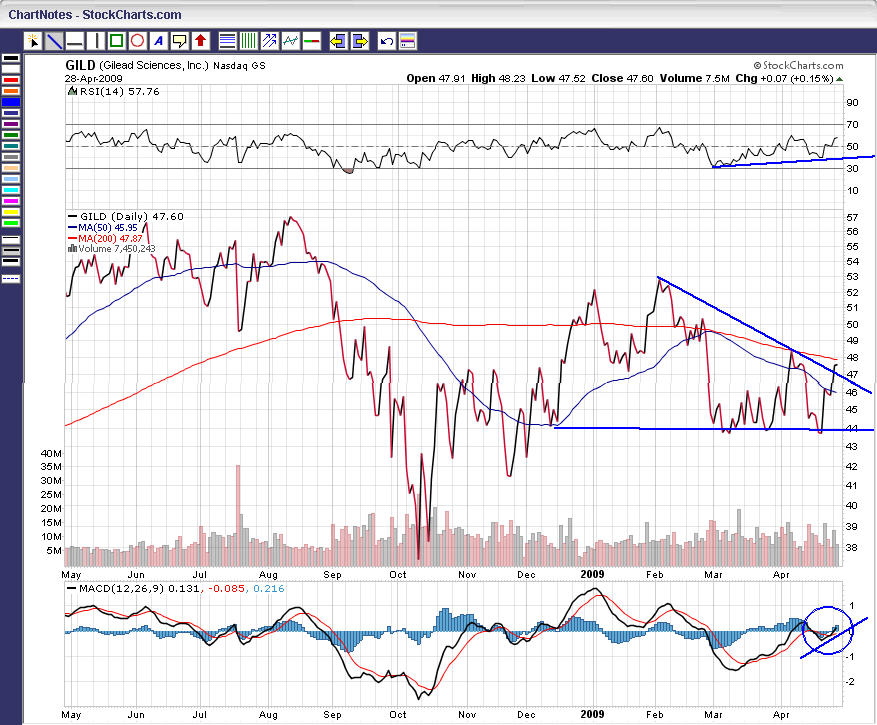
Gilead
Sciences has some really nice things going for it. The RSI is in a
steady uptrend, and the MACD just crossed over the trigger today. We
can see a very clear support line, even though the resistance line is
trending down. It's too hard to see in the picture, but the price,
which moved through the 50 dMA at $46, has broken through the
resistance trend line and is just about to cross above the 200 dMA at
$47. But the stock didn't have the strength to break through the
$48 mark in March, so we decided to wait it out.
The
current price is $47.94
Yahoo's 1-yr price target is a whopping $55.83
18 analysts have revised EPS upward in the last 30 days
The support line is at $44
We
plugged in the Yahoo analysts' estimates for 2009 and 2010 and they
are right in line with our 20% growth estimate. If the 50 dMA
can even out and start its accent again, we would definitely consider
a limit order at $44. Maybe we can pick it up on a weak day.
Lynn |
 |
Crunching Numbers
March 31, 2009
Dan and I met
to read some charts and set some target prices on stocks from our February
and March Challenge lists (available on our folders page). We
reviewed them on Navellier's PortfolioGrader Pro before we looked at the
charts. This is a free grading system. You just have to
register. Comtech
Telecom dropped to a D (sell). And AAPL, HR, HPQ, NVS all dropped to
a C (hold). There were only two stocks that we could clearly see a
pattern emerging - ESI and QSII. Here they are:
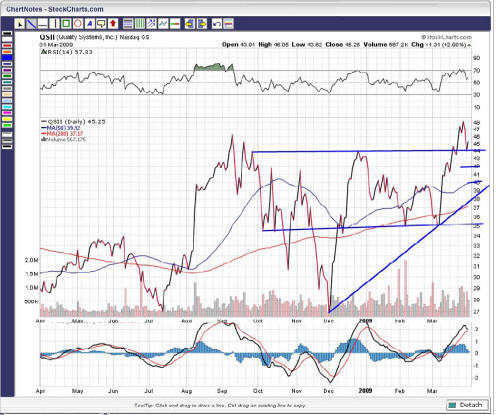
QSII:
-
Support was at $35;
- The
support trend was at $38;
- The
50 day moving average was at $40;
-
Current price was at $45;
-
Yahoo's 1 yr target price was $42;
- MACD
turned down at $43.60 and $43.50; negative on this date;
- RSI
was 57; previously hit the 70 line at $48;
-
Resistance is at $44
- We
would have to buy at $38 for a 15.7% total return in 5 years;
- We
feel we should put in a limit order at the $35 support line, with a
stop stop loss at 7%, or $32.55. Folks, that's called "margin
of safety".
|
 |
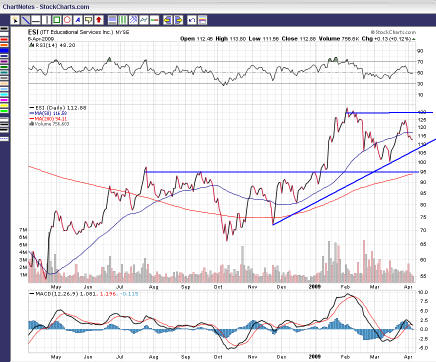
ESI:
-
Support was at $95;
- The
support trend was at $105;
- The
50 day moving average was at $117;
- The
current price was at $121.42;
- The
resistance was at $130;
- RSI
was 58; previously hit the 70 line at $126;
-
Yahoo 1 yr target price was $146;
- The
price was above the 50 and 200 day moving averages;
- If
we buy at $105 with a stop loss at $97.65, and it goes to $130, the
current resistance line, we
would have a 23.8% total return.
- If
it were to go to Yahoo's target price of $146, that would equate to
a 39% total return (simple).
Lynn |
 |
Due Diligence
March 19, 2009
It was a
typical blustery March day in Minnesota as we descended upon our local
Caribou Coffee for our monthly pow-wow. Our discussion picked up
where we left off - what do we consider due diligence? We all agreed that
we should dispense with all the mindless crap we used to bring to our
meetings and center our attention around only those items that would most
affect our decision to buy. While the jury is still out, we did come up
with this list:
-
First
and foremost - excellent quality;
-
A recent
history of growing sales, profits and earnings;
-
A
reasonable expectation that sales, profits and earnings will continue to
grow;
-
Recent
developments for the industry and the company. In other words, is
there trouble brewing?
-
And at
what price should we buy and sell?
What else
really matters, anyway? Because our screening process is so strict
on quality, we had a hard time seeing what other fundamental information
would be important enough to sway our decisions. So I posed the
question to a couple of investors who have more experience in mixing
fundamental and quantitative analysis--Mary Ann Davis and Marv Kohn.
Collectively, they suggested that each discussion should begin with the
condition of the market, as a whole, and move into economic factors that
would affect the sectors and industries of the stocks we are considering.
And of course, we would end by determining the value. Funny.
This was confirmed in an article on Ellis Traub's new website, dated April
2, 2009,
Investing Made (Really) Easy: Six Simple Steps.
It will only be as difficult as we make it!
Prior to
this meeting, I screened for our March Challenge List. This is Dan's
job, but he was in the Keys catching really big fish! Sheryl
and I reviewed the list, checked the charts, and decided to focus on Aeropostale (ARO) and ITT Educational (ESI). By meeting time, we
only had time for one, so it was ARO. Bottom Line:
- ARO has
all great fundamentals;
- Great
uptrend on a 1 year price chart
- Caters
to the 18-24 age group who considers clothing a necessity, not
discretionary;
- Just
coming into the Spring buying frenzy;
- We
looked to
Manifest Investing
to compare industry peers, and industry average sales and profits;
- We also
compared projected P/Es and target prices on several sites;
- As for
competitors, we reviewed them on Manifest, but if they didn't show up on our
Challenge List they weren't true contenders;
- While
the S&P 500 had turned up in recent days, Relative Strength Index (RSI)
was 70 (too high - going into overbought);
- The
current price was at $25.90.
- We
determined we'd have to buy at $19, with an average P/E of 12 in order
to earn a 15.5% total return in 5 years.
- And
Yahoo's 1 year target price was $27.
We
discussed putting in a limit order for $19, but Dan was concerned.
The stock would have to drop 27% to hit our buy price. And if that
were to happen, he said he'd prefer to know why before we bought it.
We all agreed to keep it on our watch list. Later, we asked Mary Ann
about this. She told us that, as fundamental investors, we don't
care if it dips that low, as long as the quality remains intact. So
next month, we'll consider it. Lynn
Decisions, Decisions
February 20, 2009
Back in March, 2008,
Dan and I worked on a stock screening process to find better quality for
our club's consideration. We named it the Challenge List. It
has evolved only slightly over the last year. Mary Ann Davis
suggested that we track the stocks that appear on this monthly list to see
if our screen is producing stocks that, not only rate high on quality, but
also perform well. Ha! Fat chance in this
market! I'll be analyzing past lists soon and I'll post the results
here. In the meantime, here are the criteria we've chosen to use for
our screen:
Stock
Screening:
Scouting for new stocks will be necessary to build and maintain a good
pounce pile. It can be done at anytime, but not less than once a month,
and the ideas can come from anywhere. Our 3 favorite screens are (in
this order):
1)
StockCentral Screener using only the
“desirable” metric;
(defined
as Take Stock Quality Rating of 6.7- 10.0; based on predictability of all
measures; affected by price)
2)
StockCentral Roster of Quality, which is
automatically updated on
StockCentral.com and in Toolkit 6 weekly; and
3)
Manifest screen using Financial Strength rating =>70 and Quality
Rating
=>60.
Challenge
List Criteria:
All
candidates will then be filtered to meet the following criteria:
First Tier--
-
Manifest Financial Strength rating => 70 and Quality rating => 60
-
Navellier PortfolioGraderPro rating of A or B (strong buy or buy);
-
NO
pink on the Toolkit 6 Pert Report;
-
Minimum of 10% Total Return on the Pert Report;
Second Tier--
-
Debt
to capital =< 20% (as shown on the front of the Stock Study form);
-
Must
be in the top 25 industries ranked for timeliness by Value Line.
-
(These are not deal breakers. We just want to track them.)
Stocks will initially be added to the list using the Toolkit 6 default
judgments. The metrics will be checked regularly (at least monthly) to
ensure they still qualify. Stocks will be dropped if they don’t meet the
minimum requirements, and new ones will be continuously added. We’ll get familiar with these stocks, modify judgments, and
review price charts to establish entry and exit points based on support
and resistance levels, and compare them with the traditional tools we
already use.
Buy
Criteria:
The
Challenge List criteria will be strictly adhered to in order maintain a list
of the highest quality stocks. The following value criteria will be
required to make a purchase:
-
S&P
500 Index (FVINX) price trending up on a one year chart (Obviously we'll
have to give a little here for now);
-
Stock’s price trending up on a one year chart;
-
Relative Strength Index
(RSI) trending up
between 50 and 70;
-
MACD line above the trigger, trending up, close to or above the zero line;
-
Potential return on the Stock Study form of at least 15%
Sell
Criteria:
A
sell price will be established at the time a stock is purchased. We’ll
set the price based, in part, on our Stock Study judgments and the Yahoo
1-yr Consensus Price Estimate. (Mary Ann has been studying the latter
for the last 2 years and found it to be fairly accurate.) The portfolio holdings will be monitored closely for
any change in the direction of the market or the individual companies. We
hope to hold our stocks for as long as possible, but we will not hesitate
to sell if we see our metrics erode. We may also place stop loss
orders, from time to time. We know this could cause premature selling, but if we correctly read
the market indicators, give ourselves a reasonable margin of safety, and buy on the upswing, we hope to hold the majority
of stocks for a long time – or at least long enough to make a reasonable
profit.
We
will either sell all or part of a holding, or put a tight stop loss under
a stock if:
-
It
hits our pre-determined sell price;
-
The
market and/or stock technical indicators turn negative;
-
The
quality metrics fall below our requirements
-
The
Navellier PortfolioGraderPro rating falls below a C (Hold);
-
The
Total Return on the Pert falls below 10%
Sold
Stocks:
We
will continue to follow the metrics of the stocks we sell to see if the
reasons we sold them are confirmed or found to be flawed.
Due
Diligence Profile:
As we
wait for opportunities to purchase stocks, we will get familiar with the
companies on our watch list. We will develop a Due Diligence Profile to
be completed on every stock prior to purchase. This will be a check
list of items that we believe will most affect our decision to buy.
Lynn
The Grand Experiment
February 13, 2009
Friday the 13th! What an awesome day to start something new!
Sheryl, Dan and I had been studying, reading, and conversing for months
about finding a way to pick better entry and exit points for our club stocks.
Today, we met and decided to make it a formal "grand experiment." We
discussed our the parameters for our screening process and drank lots of
coffee (even told a joke or two!). We each went our separate way to
ponder our next move...to be decided at our next coffee clatch on
February 20th.
So how did this all get started in the first place? Well, we like to
blame it on Mary Ann Davis (!) for opening our eyes to "other
possibilities." In her class There Is A Time To Buy,
which Sheryl and I saw at InvestEd 2008 (and later shared with Dan back
home), she showed us how we could make better buy and sell decisions by
adding a little quantitative analysis to our due diligence. Back in
November (2008), well after the recession started and everybody's stocks
were in the toilet, the club elected to purchase Quality Systems, Inc. (QSII)
at a price derived from analyzing its chart based on Mary Ann's method.
This was a very high quality stock that seemed unaffected by the carnage.
We purchased it on November 12th at $35.38 with the intention of holding
it forever...or until it stopped climbing. <g>
To our amazement, it continued to climb while our other stocks were
tanking. Dan, who watches the market everyday, noticed in January
that QSII had breached its resistance level of $48 and was heading back
down. We all jumped on the club's message board to discuss whether
we should lock in our gain. Remember this was an experiment with
only one stock. We would not have called for this kind of decision
on our other stocks. All but one member responded with a SELL, SELL,
SELL. In the time it took waiting for everyone to chime in (1-1/2
days), it was sold at $43.15 on January 5th. In the bleakest hour of
2008, a year that sent the Dow down 31.9% and the S&P down 37%, we made a
short term trade that earned us a simple return of 22%. Now I ask
you. If we can do that in a bad market, how might we fare in a good
one? Dan, Sheryl and I seemed to be the only ones excited by the
possibilities. So hence...we decided to band together for this grand
experiment. Stay tuned as we air our achievements and failures for
all the world to see! Lynn
|
| |
|
|