Regarding portfolio management.
Hello,
Just wandering if any one has suggestions about following stocks at a glance for monthly meeting. Also what criteria we absolutely should look for?
Any suggestion is welcome.
Sent from my iPhone
Just wandering if any one has suggestions about following stocks at a glance for monthly meeting. Also what criteria we absolutely should look for?
Any suggestion is welcome.
Sent from my iPhone
We use a Google spreadsheet that contains the following columns and project or share it during the meeting:
Total Value
Cost
Cost/share
Gain
% Gain
Buy Price
Over Valued Price
% Yield
PE
Upside/Downside Ratio
Market Cap
Debt
Price/book Value
PEG Ratio
Dividend
Avg PE
Book Value / Share
Earnings Growth Rate
Shares
Total Debt
Sales/Revenue
Inst Ownership
Symbol
Cost
Cost/share
Gain
% Gain
Buy Price
Over Valued Price
% Yield
PE
Upside/Downside Ratio
Market Cap
Debt
Price/book Value
PEG Ratio
Dividend
Avg PE
Book Value / Share
Earnings Growth Rate
Shares
Total Debt
Sales/Revenue
Inst Ownership
Symbol
Google sheets provides some of this information live.
sb
Hello,
Just wandering if any one has suggestions about following stocks at a glance for monthly meeting. Also what criteria we absolutely should look for?
Any suggestion is welcome.
Sent from my iPhone
I'm not exactly sure what you're asking here, but if you use Bivio, the Net Asset Value (NAV) report gives you the previous day's close. IClub's services are probably similar. I've created a Yahoo Finance portfolio of our club's holdings (data is about as close to real time as you'll find). At some point before the meeting, I print the Bivio NAV report and after the market closes I make pen & ink changes to reflect that day's close. You could probably just use the Yahoo page, but in doing so you wouldn't have some of the other data that's on the NAV report. I'm sure there are probably other ways to get this information. Maybe if you have access to your broker's records it would be available there as well.
Hello,
Just wandering if any one has suggestions about following stocks at a glance for monthly meeting. Also what criteria we absolutely should look for?
Any suggestion is welcome.
Sent from my iPhone
We also use the Valuation (NAV) report from bivio - to which I add the Performance Benchmark report (comparing our holdings to VFINX - Vanguard 500 Index Fund. We also use Manifest Investing so I add their PAR, Quality, Growth figures for the portfolio. I also give them the Member Performance report.
On Wednesday, January 6, 2021, 03:22:59 PM EST, Aruna Parekh via bivio.com <user*21402800001@bivio.com> wrote:
Hello,
Just wandering if any one has suggestions about following stocks at a glance for monthly meeting. Also what criteria we absolutely should look for?
Any suggestion is welcome.
Sent from my iPhone
Hi Aruna,
Both model clubs that I am in use a Google spreadsheet as a "dashboard" to show, at a quick glance, all the stocks in the portfolio, as well as those on the watch list.
Features are:
Google finance can enter current prices whenever the markets are open.Club members can update with information on the stock(s) they are followingIt is focused on the future -- cost basis for each investment is in the spreadsheet but we hide those columns
Here is a link to a sample that you can copy and use:
https://docs.google.com/spreadsheets/d/1ZviMbQYo9jjDEOvrACIMF3xtuUQ0s0TgxiX3V3xwI2g/edit?usp=sharing
Over time we have added other features to this demo version. You can do the same, depending on your interests.
Hope you find this useful. If you have any questions, don't hesitate to ask.
Dave Swierenga
Long Star Online Investment club
On Wednesday, January 6, 2021, 2:22:43 PM CST, Aruna Parekh via bivio.com <user*21402800001@bivio.com> wrote:
Hello,
Just wandering if any one has suggestions about following stocks at a glance for monthly meeting. Also what criteria we absolutely should look for?
Any suggestion is welcome.
Sent from my iPhone
Aruna, if you will send me a private email, I will share with you an example of the Portfolio Review report I've done for my clubs. It's done as a PowerPoint. Once created it can be very quick to update. It's very visual.
Linda
Hello,
Just wandering if any one has suggestions about following stocks at a glance for monthly meeting. Also what criteria we absolutely should look for?
Any suggestion is welcome.
Sent from my iPhone
We use Bivio's Investment Lots report (need to check name) which shows each stock we own and the date and market price of each purchase. To that we insert a line graph showing movement in prices since the beginning of the year. Also easy to show an index on that graph.
We also use the Valuation (NAV) report from bivio - to which I add the Performance Benchmark report (comparing our holdings to VFINX - Vanguard 500 Index Fund. We also use Manifest Investing so I add their PAR, Quality, Growth figures for the portfolio. I also give them the Member Performance report.On Wednesday, January 6, 2021, 03:22:59 PM EST, Aruna Parekh via bivio.com <user*21402800001@bivio.com> wrote:Hello,Just wandering if any one has suggestions about following stocks at a glance for monthly meeting. Also what criteria we absolutely should look for?Any suggestion is welcome.Sent from my iPhone
Stuart, I agree. In one of my clubs we used Bivio's NAV report. In another we used Morningstar Portfolio. In another we use myICLUB. All give needed tracking info.
Thank you,
Roy Chastain
"I am coming to be quite contented learning to do very little - slowly." Lionel Hardcastle [In "As Time Goes By"]
Thank you,
Roy Chastain
"I am coming to be quite contented learning to do very little - slowly." Lionel Hardcastle [In "As Time Goes By"]
On Jan 6, 2021, at 1:47 PM, Stuart Lange via bivio.com <user*25028600001@bivio.com> wrote:I'm not exactly sure what you're asking here, but if you use Bivio, the Net Asset Value (NAV) report gives you the previous day's close. IClub's services are probably similar. I've created a Yahoo Finance portfolio of our club's holdings (data is about as close to real time as you'll find). At some point before the meeting, I print the Bivio NAV report and after the market closes I make pen & ink changes to reflect that day's close. You could probably just use the Yahoo page, but in doing so you wouldn't have some of the other data that's on the NAV report. I'm sure there are probably other ways to get this information. Maybe if you have access to your broker's records it would be available there as well.Hello,
Just wandering if any one has suggestions about following stocks at a glance for monthly meeting. Also what criteria we absolutely should look for?
Any suggestion is welcome.
Sent from my iPhone
We use the portfolio tool in the SSG to maintain our portfolio.
We also subscribe to Manifest Investing and maintain a copy of our portfolio there.
Every stock has a stock watcher whose duty is to keep up with the stock which includes quarterly reports.
We try to accomplish 5-6 industry studies a year to improve our portfolio.
At mid-month our stock watcher manager sends out a list showing the status of all portfolio stocks.
This is helpful because it reminds the SW's to review their stocks for anomaly's.
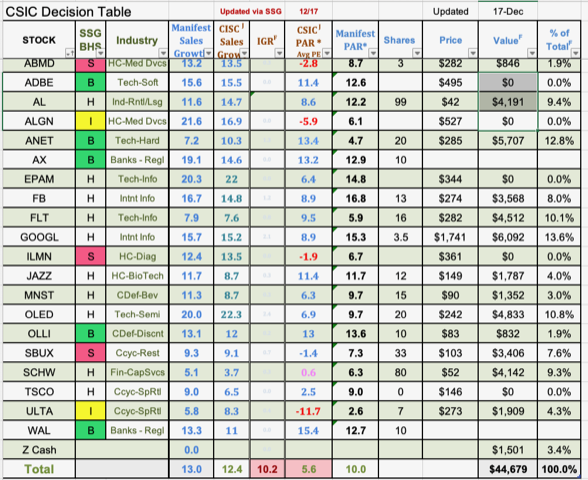
Before each meeting I update a spreadsheet I created to merge the information from Manifest and our SSg's;.
We then use this spreadsheet to help us during our buy and sell session to decide what stocks need to be purchased or sold.
I have attached a screenshot of this spreadsheet below.
We are always looking for better ways of doing things and we are happy with our club performance.
According to bivio's calculations we have an IRR of 27.2% for the almost 3 year life of the club.
We recently added this table to let use make a quick comparison between Manifest's numbers and our club's numbers.
Bob Shaw
President
Classic Strategy Investment Club
On Jan 6, 2021, at 3:22 PM, Aruna Parekh via bivio.com <user*21402800001@bivio.com> wrote:Hello,
Just wandering if any one has suggestions about following stocks at a glance for monthly meeting. Also what criteria we absolutely should look for?
Any suggestion is welcome.
Sent from my iPhone
Thanks a lot.
One more question. This is a lot more details and we study that. But when we want to consider buying more or sell the stocks, what do you look into consideration at a glance.
Sent from my iPhone
On Jan 6, 2021, at 4:38 PM, SB via bivio.com <user*1595500001@bivio.com> wrote:
We use a Google spreadsheet that contains the following columns and project or share it during the meeting:Total Value
Cost
Cost/share
Gain
% Gain
Buy Price
Over Valued Price
% Yield
PE
Upside/Downside Ratio
Market Cap
Debt
Price/book Value
PEG Ratio
Dividend
Avg PE
Book Value / Share
Earnings Growth Rate
Shares
Total Debt
Sales/Revenue
Inst Ownership
SymbolGoogle sheets provides some of this information live.sbHello,
Just wandering if any one has suggestions about following stocks at a glance for monthly meeting. Also what criteria we absolutely should look for?
Any suggestion is welcome.
Sent from my iPhone
The left side of the spreadsheet (up to column T) displays nicely on one screen without using sliders. This is what we use to help us debate what to buy more of or what to consider selling. The right side of the spreadsheet contains data used to calculate what is on the left. I have linked a redacted copy below for you to look at. You will notice that there is an entry where Google Finance does not provide data. This usually raises some questions.
(https://docs.google.com/spreadsheets/d/16suaAMY-BjZEZj3gUYAx7_OoPo8GPe4AQtaMA-tpw8M/edit?usp=sharing)
sb
Thanks a lot.One more question. This is a lot more details and we study that. But when we want to consider buying more or sell the stocks, what do you look into consideration at a glance.Sent from my iPhoneOn Jan 6, 2021, at 4:38 PM, SB via bivio.com <user*1595500001@bivio.com> wrote:We use a Google spreadsheet that contains the following columns and project or share it during the meeting:Total Value
Cost
Cost/share
Gain
% Gain
Buy Price
Over Valued Price
% Yield
PE
Upside/Downside Ratio
Market Cap
Debt
Price/book Value
PEG Ratio
Dividend
Avg PE
Book Value / Share
Earnings Growth Rate
Shares
Total Debt
Sales/Revenue
Inst Ownership
SymbolGoogle sheets provides some of this information live.sbHello,
Just wandering if any one has suggestions about following stocks at a glance for monthly meeting. Also what criteria we absolutely should look for?
Any suggestion is welcome.
Sent from my iPhone
>But when we want to consider buying more or sell the stocks, what do you look into consideration at a glance?
We highly recommend starting with your objective or target -- BETTER RETURNS.
At Manifest Investing, the primary purpose of dashboards is to aid the decision process by highlighting the Projected Annual Return (PAR), the return forecast consistent with Section 5 of a Stock Selection Guide, for BOTH the individual positions and the overall portfolio. We believe that selling decisions should be made in a portfolio-centered context.
In a nutshell, we trigger sell considerations when your PAR approaches money market rates for core (read high-quality blue chip) holdings.
For non-core positions, we'll trigger a selling consideration when the PAR approaches average market return forecasts.
Strive to maintain the overall [weighted average] return forecast for the portfolio at an acceptable level above the average market return forecast.
Maintain target ranges for overall quality and sales growth forecast (prudent portfolio diversification).
Here's an example dashboard for our Round Table (Core) portfolio: https://www.manifestinvesting.com/dashboards/public/round-table
The Round Table portfolio reflects the decisions made during monthly FREE webcasts. We invest $1000 every time a company is featured by a contributor or selected by audience poll. (The legend provides the number of repeat selections ... MSFT, 5 selections [$5000] has become $52,823.) The rate of return for this stock discovery and analysis demonstration is 22.2% for the trailing five years and 18.4% since 2010.
Mark Robertson
Founder and Managing Partner
Manifest Investing
The left side of the spreadsheet (up to column T) displays nicely on one screen without using sliders. This is what we use to help us debate what to buy more of or what to consider selling. The right side of the spreadsheet contains data used to calculate what is on the left. I have linked a redacted copy below for you to look at. You will notice that there is an entry where Google Finance does not provide data. This usually raises some questions.(https://docs.google.com/spreadsheets/d/16suaAMY-BjZEZj3gUYAx7_OoPo8GPe4AQtaMA-tpw8M/edit?usp=sharing)sbThanks a lot.One more question. This is a lot more details and we study that. But when we want to consider buying more or sell the stocks, what do you look into consideration at a glance.Sent from my iPhoneOn Jan 6, 2021, at 4:38 PM, SB via bivio.com <user*1595500001@bivio.com> wrote:We use a Google spreadsheet that contains the following columns and project or share it during the meeting:Total Value
Cost
Cost/share
Gain
% Gain
Buy Price
Over Valued Price
% Yield
PE
Upside/Downside Ratio
Market Cap
Debt
Price/book Value
PEG Ratio
Dividend
Avg PE
Book Value / Share
Earnings Growth Rate
Shares
Total Debt
Sales/Revenue
Inst Ownership
SymbolGoogle sheets provides some of this information live.sbHello,
Just wandering if any one has suggestions about following stocks at a glance for monthly meeting. Also what criteria we absolutely should look for?
Any suggestion is welcome.
Sent from my iPhone
Very nice and looks Great!!
Need to know the following: 1. How to get the buy price, and 2. Meaning of the symbols.
Regards
Sam
![]()
-----Original Message-----
From: SB via bivio.com <user*1595500001@bivio.com>
To: club_cafe@bivio.com
Sent: Thu, Jan 7, 2021 5:12 am
Subject: Re: [club_cafe] Regarding portfolio management.
From: SB via bivio.com <user*1595500001@bivio.com>
To: club_cafe@bivio.com
Sent: Thu, Jan 7, 2021 5:12 am
Subject: Re: [club_cafe] Regarding portfolio management.
The left side of the spreadsheet (up to column T) displays nicely on one screen without using sliders. This is what we use to help us debate what to buy more of or what to consider selling. The right side of the spreadsheet contains data used to calculate what is on the left. I have linked a redacted copy below for you to look at. You will notice that there is an entry where Google Finance does not provide data. This usually raises some questions.
(https://docs.google.com/spreadsheets/d/16suaAMY-BjZEZj3gUYAx7_OoPo8GPe4AQtaMA-tpw8M/edit?usp=sharing)
sb
Thanks a lot.One more question. This is a lot more details and we study that. But when we want to consider buying more or sell the stocks, what do you look into consideration at a glance.
Sent from my iPhoneOn Jan 6, 2021, at 4:38 PM, SB via bivio.com <user*1595500001@bivio.com> wrote:We use a Google spreadsheet that contains the following columns and project or share it during the meeting:Total Value
Cost
Cost/share
Gain
% Gain
Buy Price
Over Valued Price
% Yield
PE
Upside/Downside Ratio
Market Cap
Debt
Price/book Value
PEG Ratio
Dividend
Avg PE
Book Value / Share
Earnings Growth Rate
Shares
Total Debt
Sales/Revenue
Inst Ownership
SymbolGoogle sheets provides some of this information live.sb
Hello,
Just wandering if any one has suggestions about following stocks at a glance for monthly meeting. Also what criteria we absolutely should look for?
Any suggestion is welcome.
Sent from my iPhone
The buy and overvalued prices are determined by using the Stock Selection Guide. The 'B' symbol indicates the current price is below the buy level and the 'spade' indicates the current price is above the overvalued price.
sb
Very nice and looks Great!!
Need to know the following: 1. How to get the buy price, and 2. Meaning of the symbols.
RegardsSam
![]()
-----Original Message-----
From: SB via bivio.com <user*1595500001@bivio.com>
To: club_cafe@bivio.com
Sent: Thu, Jan 7, 2021 5:12 am
Subject: Re: [club_cafe] Regarding portfolio management.
The left side of the spreadsheet (up to column T) displays nicely on one screen without using sliders. This is what we use to help us debate what to buy more of or what to consider selling. The right side of the spreadsheet contains data used to calculate what is on the left. I have linked a redacted copy below for you to look at. You will notice that there is an entry where Google Finance does not provide data. This usually raises some questions.(https://docs.google.com/spreadsheets/d/16suaAMY-BjZEZj3gUYAx7_OoPo8GPe4AQtaMA-tpw8M/edit?usp=sharing)sb
Thanks a lot.One more question. This is a lot more details and we study that. But when we want to consider buying more or sell the stocks, what do you look into consideration at a glance.
Sent from my iPhoneOn Jan 6, 2021, at 4:38 PM, SB via bivio.com <user*1595500001@bivio.com> wrote:We use a Google spreadsheet that contains the following columns and project or share it during the meeting:Total Value
Cost
Cost/share
Gain
% Gain
Buy Price
Over Valued Price
% Yield
PE
Upside/Downside Ratio
Market Cap
Debt
Price/book Value
PEG Ratio
Dividend
Avg PE
Book Value / Share
Earnings Growth Rate
Shares
Total Debt
Sales/Revenue
Inst Ownership
SymbolGoogle sheets provides some of this information live.sb
Hello,
Just wandering if any one has suggestions about following stocks at a glance for monthly meeting. Also what criteria we absolutely should look for?
Any suggestion is welcome.
Sent from my iPhone
Thanks for the info.
Sam
-----Original Message-----
From: SB via bivio.com <user*1595500001@bivio.com>
To: club_cafe@bivio.com
Sent: Thu, Jan 7, 2021 10:50 am
Subject: Re: [club_cafe] Regarding portfolio management.
From: SB via bivio.com <user*1595500001@bivio.com>
To: club_cafe@bivio.com
Sent: Thu, Jan 7, 2021 10:50 am
Subject: Re: [club_cafe] Regarding portfolio management.
The buy and overvalued prices are determined by using the Stock Selection Guide. The 'B' symbol indicates the current price is below the buy level and the 'spade' indicates the current price is above the overvalued price.
sb
Very nice and looks Great!!
Need to know the following: 1. How to get the buy price, and 2. Meaning of the symbols.
RegardsSam
![]()
-----Original Message-----
From: SB via bivio.com <user*1595500001@bivio.com>
To: club_cafe@bivio.com
Sent: Thu, Jan 7, 2021 5:12 am
Subject: Re: [club_cafe] Regarding portfolio management.
The left side of the spreadsheet (up to column T) displays nicely on one screen without using sliders. This is what we use to help us debate what to buy more of or what to consider selling. The right side of the spreadsheet contains data used to calculate what is on the left. I have linked a redacted copy below for you to look at. You will notice that there is an entry where Google Finance does not provide data. This usually raises some questions.(https://docs.google.com/spreadsheets/d/16suaAMY-BjZEZj3gUYAx7_OoPo8GPe4AQtaMA-tpw8M/edit?usp=sharing)sb
Thanks a lot.One more question. This is a lot more details and we study that. But when we want to consider buying more or sell the stocks, what do you look into consideration at a glance.
Sent from my iPhoneOn Jan 6, 2021, at 4:38 PM, SB via bivio.com <user*1595500001@bivio.com> wrote:We use a Google spreadsheet that contains the following columns and project or share it during the meeting:Total Value
Cost
Cost/share
Gain
% Gain
Buy Price
Over Valued Price
% Yield
PE
Upside/Downside Ratio
Market Cap
Debt
Price/book Value
PEG Ratio
Dividend
Avg PE
Book Value / Share
Earnings Growth Rate
Shares
Total Debt
Sales/Revenue
Inst Ownership
SymbolGoogle sheets provides some of this information live.sb
Hello,
Just wandering if any one has suggestions about following stocks at a glance for monthly meeting. Also what criteria we absolutely should look for?
Any suggestion is welcome.
Sent from my iPhone